 Soba
Model comparison · October 2026
Eight AI models, 200 meal photos: 53% to 73% of carb estimates within 10 g
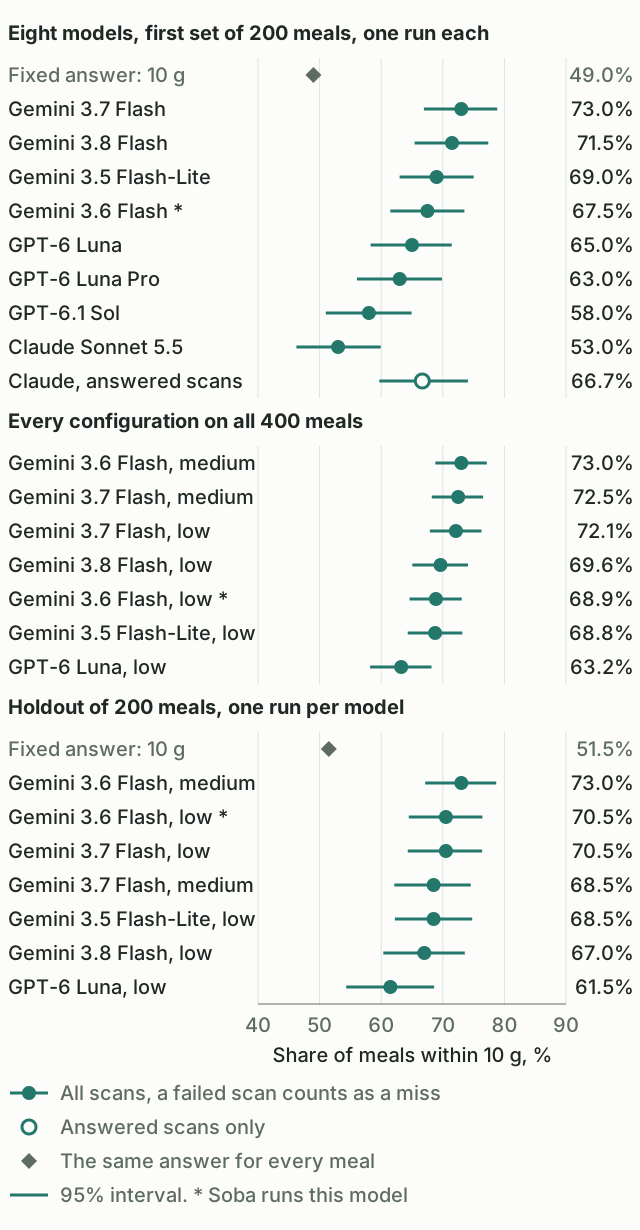
Four Gemini Flash models reached 67.5% to 73.0%, and three OpenAI models reached 58.0% to 65.0%. Claude Sonnet 5.5 reached 53.0% with 41 failed scans counted as misses, and 66.7% on the scans it answered. The intervals of the four Gemini models overlap, so this test names no single best model.
73.0%highest of four Gemini Flash models, which reached 67.5% to 73.0%
65.0%highest of three OpenAI models, which reached 58.0% to 65.0%
53.0%Claude Sonnet 5.5 through OpenRouter and Azure, or 66.7% on answered scans
Where each model landed
All eight models saw the same 200 photos with the same prompt, one run each. A failed scan counts as a miss in the share within 10 g. The other error columns use answered scans only.
Table 1. Eight models on the first set of 200 meals
| Model | Within 10 g, 95% interval | Mean absolute error, g | Bias, g | Errors above 30 g | Failed scans | Cost per scan, $ | Median time, s |
|---|---|---|---|---|---|---|---|
| Gemini 3.7 Flash | 73.0% 66.9 to 78.8 | 9.5 | −1.0 | 5.5% | 0 | 0.0036 | 3.7 |
| Gemini 3.8 Flash | 71.5% 65.4 to 77.4 | 9.9 | −0.8 | 7.0% | 0 | 0.0030 | 4.8 |
| Gemini 3.5 Flash-Lite | 69.0% 63.0 to 75.0 | 10.2 | +0.4 | 6.0% | 0 | 0.0017 | 2.1 |
| Gemini 3.6 Flash * | 67.5% 61.5 to 73.5 | 10.1 | −1.4 | 5.5% | 0 | 0.0028 | 3.3 |
| GPT-6 Luna | 65.0% 58.3 to 71.5 | 10.7 | +1.2 | 8.0% | 0 | 0.0003 | 6.9 |
| GPT-6 Luna Pro | 63.0% 56.1 to 69.9 | 11.1 | +1.9 | 8.0% | 0 | 0.0010 | 11.7 |
| GPT-6.1 Sol | 58.0% 51.0 to 64.9 | 14.9 | +10.1 | 11.5% | 0 | 0.0071 | 13.1 |
| Claude Sonnet 5.5 | 53.0% 46.2 to 59.9 | 10.9 | +1.1 | 6.3% | 41 | 0.0145 | 6.0 |
| Claude Sonnet 5.5, answered scans only | 66.7% 59.7 to 74.1 | 10.9 | +1.1 | 6.3% | 0 | 0.0138 | 5.2 |
* Soba runs this model on low reasoning. The star marks it in every table. The second line of a share is its 95% interval. Errors above 30 g are a share of answered scans.
- The scale starts near 50%. A fixed answer of 10 g for every meal would reach 49.0%, because 49.0% of these meals hold 20 g of carbs or less.
- GPT-6.1 Sol overestimates most, by 10.1 g on average. The other seven models stay within 2 g of zero.
- GPT-6 Luna costs least, $0.0003 per scan. Claude Sonnet 5.5 costs most, $0.0145.
- Gemini 3.5 Flash-Lite is the fastest, with a median of 2.1 s. GPT-6.1 Sol is the slowest, with 13.1 s.
What we measured
A scan sends one photo to a model and asks what is on the plate. The model answers with net carbs and fiber for each food. We add the two, because the datasets list total carbs. Then we compare the sum with the reference value of the meal.
The main measure is the share of meals where the difference is 10 g or less. The 10 g line is our choice, and the data file lets you test any other line.
- Mean absolute error: the average size of the error, in grams.
- Bias: the average signed error. A minus means that the model estimates too low.
- Errors above 30 g: gross misses, as a share of answered scans.
- Failed scan: a scan with no valid answer after one retry. It counts as a miss in the share within 10 g, and it has no error in the other columns.
- Cost per scan: what OpenRouter billed for the run, retries included.
- Median time: the whole scan, retries included.
Data
Two public research datasets give the photos and the reference values. Each set of 200 meals holds 100 meals from each dataset.
Nutrition5k: weighed plates
Nutrition5k plates come from Google cafeterias. Every ingredient was weighed, and a fixed camera took each photo from directly above. These are the surest reference values in this test. The license is CC BY 4.0.
SNAPMe: home photos with a food diary
SNAPMe comes from the US Department of Agriculture and UC Davis. 95 people in the US photographed their own meals before they ate and kept a food diary in ASA24, a dietary assessment tool. The reference value is the sum of the diary rows linked to a photo, so it carries the errors of the diary. The license is CC BY-SA 4.0.
The publisher names nutrient prediction benchmarks as an intended use, and it asks users to train no models on this small dataset. This test trains nothing. This page and the data files hold no SNAPMe photos.
How the script picked the meals
A script with a fixed seed took 25 meals from each quarter of the carb range, per dataset. It started from 505 Nutrition5k plates in the official test split and 1,457 SNAPMe photos taken before a meal. It took at most 2 photos per SNAPMe participant. Plates from one ten-minute window often look alike. The script took 1 plate per window for the first set and up to 3 for the holdout.
The script picked the holdout the same way. The holdout shares no photo, meal or ten-minute window with the first set, while SNAPMe participants can appear in both. The median reference value is 20.3 g in the first set and 19.1 g in the holdout.
Method and prompt protocol
Every scan sent one photo and the same prompt through OpenRouter on 7 October 2026. No scan had a text hint, depth data or a later correction. We reduced each photo to 1,024 pixels on the longest side, JPEG quality 70. The test code set the answer language to Russian.
- Provider: OpenRouter chose Google AI Studio for Gemini, OpenAI for the OpenAI models and Azure for Claude. The request allowed no fallback to another model and set
data_collectiontodeny. - Answer format: a strict JSON schema. A check rejects an empty food name and a weight outside 0 to 5,000 g, then sends one retry with the reason.
- Reasoning: low for all eight models. Low differs by vendor. The mean per first attempt is 0 to 39 reasoning tokens for Gemini and Claude, and 68 to 590 for OpenAI.
- Temperature: 0.2, except for OpenAI models, which do not accept this setting.
- Answer limit: 8,192 tokens on the first set, 4,096 on the holdout and 16,384 with medium reasoning. Normal answers stay under 3,000 tokens.
The prompt in words
The prompt is the one Soba used in October 2026. We keep its text private and describe it here. It asks the model for these steps:
- Name each edible item, and split a composite dish into its parts.
- Estimate the weight from scale first: objects of known size, area times layer height times density, or count times unit weight.
- State the basis for each weight, and give a minimum and a maximum.
- Give nutrition per 100 g in the state shown, with net carbs and fiber apart.
- Copy the values from a visible label.
We wrote and tuned this prompt on Gemini, so it can favor Gemini.
Intervals
The 95% intervals come from a cluster bootstrap with 10,000 resamples and seed 20261007. A cluster is one SNAPMe participant or one Nutrition5k ten-minute window. The script resamples clusters inside each dataset, and both datasets weigh the same. Differences between models use the same resamples on the same meals.
We made no correction for multiple comparisons. Eight models make 28 pairs, so one or two pairs can exclude zero by chance.
Results on 200 meals: which gaps hold up
Table 2 compares the models meal by meal. Bold marks a difference with a 95% interval that excludes zero. A minus means that the model in the row scores lower than the model in the column.
Table 2. Differences on the first set, in points
| Model | Difference from Gemini 3.7 Flash, points | Difference from Gemini 3.8 Flash, points | Difference from Gemini 3.5 Flash-Lite, points | Difference from Gemini 3.6 Flash, points |
|---|---|---|---|---|
| Gemini 3.7 Flash | baseline | +1.5 −2.5 to +5.5 | +4.0 −1.4 to +9.4 | +5.5 +0.9 to +10.3 |
| Gemini 3.8 Flash | −1.5 −5.5 to +2.5 | baseline | +2.5 −2.5 to +7.7 | +4.0 −0.5 to +8.6 |
| Gemini 3.5 Flash-Lite | −4.0 −9.4 to +1.4 | −2.5 −7.7 to +2.5 | baseline | +1.5 −3.0 to +6.0 |
| Gemini 3.6 Flash * | −5.5 −10.3 to −0.9 | −4.0 −8.6 to +0.5 | −1.5 −6.0 to +3.0 | baseline |
| GPT-6 Luna | −8.0 −14.5 to −1.5 | −6.5 −13.2 to +0.4 | −4.0 −10.5 to +2.7 | −2.5 −9.5 to +4.7 |
| GPT-6 Luna Pro | −10.0 −17.1 to −3.0 | −8.5 −15.5 to −1.5 | −6.0 −13.0 to +1.0 | −4.5 −12.0 to +2.9 |
| GPT-6.1 Sol | −15.0 −22.1 to −7.7 | −13.5 −20.7 to −6.0 | −11.0 −17.5 to −4.6 | −9.5 −16.1 to −2.7 |
| Claude Sonnet 5.5 | −20.0 −26.6 to −13.1 | −18.5 −25.0 to −11.8 | −16.0 −22.4 to −9.5 | −14.5 −20.9 to −8.0 |
- The four Gemini Flash models are close. One of their six pairs excludes zero: Gemini 3.7 Flash against Gemini 3.6 Flash, +5.5 points. The holdout did not repeat it.
- GPT-6.1 Sol and Claude Sonnet 5.5, with failed scans as misses, score below all four Gemini Flash models.
- GPT-6 Luna scores below Gemini 3.7 Flash only. GPT-6 Luna Pro scores below Gemini 3.7 and 3.8 Flash. Their other differences include zero.
Repeat runs show the noise. Gemini 3.6, 3.7 and 3.8 Flash ran twice on these photos. Their shares moved from 67.5 to 67.0%, 73.0 to 74.5% and 71.5 to 73.0%. The outcome stayed the same on 94.5% to 95.5% of meals. The median gap between two answers on one photo was about 1 g, and the largest was 59.5 g.
Table 3. The same run by dataset
| Model | Nutrition5k, weighed: within 10 g | Nutrition5k: mean absolute error, g | SNAPMe, diary: within 10 g | SNAPMe: mean absolute error, g |
|---|---|---|---|---|
| Gemini 3.7 Flash | 82.0% 74.0 to 89.0 | 5.4 | 64.0% 54.5 to 73.2 | 13.6 |
| Gemini 3.8 Flash | 80.0% 72.0 to 87.0 | 5.9 | 63.0% 53.5 to 72.1 | 13.9 |
| Gemini 3.5 Flash-Lite | 81.0% 73.0 to 88.0 | 5.7 | 57.0% 47.1 to 66.7 | 14.7 |
| Gemini 3.6 Flash * | 80.0% 72.0 to 87.0 | 6.4 | 55.0% 45.5 to 64.4 | 13.7 |
| GPT-6 Luna | 71.0% 62.0 to 80.0 | 8.6 | 59.0% 49.0 to 68.6 | 12.7 |
| GPT-6 Luna Pro | 66.0% 57.0 to 75.0 | 9.3 | 60.0% 49.5 to 69.6 | 12.9 |
| GPT-6.1 Sol | 60.0% 50.0 to 70.0 | 11.1 | 56.0% 46.0 to 66.0 | 18.6 |
| Claude Sonnet 5.5 | 57.0% 47.0 to 67.0 | 6.8 | 49.0% 39.4 to 58.6 | 14.7 |
The gap between Gemini and OpenAI sits on the weighed plates. There the four Gemini Flash models reach 80% to 82%, and the OpenAI models 60% to 71%. GPT-6 Luna Pro and GPT-6.1 Sol score 14 and 20 points below Gemini 3.6 Flash, with intervals that exclude zero.
On the home photos the OpenAI models reach 56% to 60%, inside the Gemini range of 55% to 64%. There only Gemini 3.7 and 3.8 Flash differ from Gemini 3.6 Flash with intervals that exclude zero, by +9 and +8 points. Home photos are harder for every model, and their diary reference values add errors of their own.
Other runs
Other runs on these photos changed the protocol, so they stay out of the tables. They used other prompt versions, temperature off, high reasoning, text hints and depth data. The accuracy page reports hints, depth and Soba’s later code, which reached 68.5% on 400 meals where Table 5 shows 68.9%. A ninth model, Gemini 3.1 Pro Preview, ran on later code without temperature and reached 66.0% (59.3 to 72.5). Our notes also record a Qwen model that we dropped after a short trial. We kept no raw data from it, so it has no numbers here.
Claude Sonnet 5.5 through OpenRouter and Azure
Claude Sonnet 5.5 is the only model with failed scans, so it gets two views. With failed scans as misses it reaches 53.0%. On the 159 scans with an answer it reaches 66.7%. The first view shows what a person gets from this route. The second shows the model when it answers.
OpenRouter sent all 286 requests to Azure, and each one returned HTTP 200 with a normal finish. On 86 of 200 first attempts, the answer held one item with an empty name and 0 g, while the dish name was filled. Our check rejected these answers and sent one retry.
- 41 retries came back empty again. These are the 41 failed scans: 24 on Nutrition5k and 17 on SNAPMe.
- 40 retries gave a real answer.
- 5 retries gave a placeholder: one item named “x” with 1 g and no nutrition. Our check accepted these, so they count as estimates of 0 g, and 2 of them land within 10 g.
Table 4. All models on the meals that Claude answered
| Model | 159 meals: within 10 g | 159 meals: mean absolute error, g | Difference from Claude, points | 154 meals: within 10 g | 154 meals: mean absolute error, g |
|---|---|---|---|---|---|
| Gemini 3.7 Flash | 73.0% 66.7 to 79.9 | 10.1 | +6.3 0.0 to +12.8 | 72.1% | 10.3 |
| Gemini 3.8 Flash | 73.0% 66.7 to 79.6 | 10.3 | +6.3 0.0 to +12.8 | 72.1% | 10.5 |
| Gemini 3.5 Flash-Lite | 71.7% 65.4 to 78.7 | 10.2 | +5.0 −1.0 to +11.7 | 70.8% | 10.5 |
| Gemini 3.6 Flash * | 69.2% 62.9 to 76.4 | 10.1 | +2.5 −3.6 to +9.1 | 68.2% | 10.4 |
| GPT-6 Luna | 67.3% 60.4 to 74.8 | 10.0 | +0.6 −6.9 to +8.2 | 68.2% | 9.7 |
| GPT-6 Luna Pro | 64.8% 57.3 to 72.2 | 10.5 | −1.9 −10.0 to +5.9 | 66.2% | 10.2 |
| GPT-6.1 Sol | 62.9% 55.1 to 70.8 | 14.5 | −3.8 −11.7 to +3.7 | 64.3% | 14.3 |
| Claude Sonnet 5.5 | 66.7% 59.7 to 74.1 | 10.9 | baseline | 67.5% | 10.6 |
On the 159 meals, Gemini 3.7 and 3.8 Flash reach 73.0%. That is 6.3 points above Claude, with an interval from 0.0 to +12.8, and every other difference includes zero. Without the 5 placeholders, on 154 meals, Claude reaches 67.5% and every difference includes zero. So on the meals it answered, Claude is level with the other models within the intervals.
Both views have limits. The 53.0% can describe the route and say little about the model. We tried no other route, and we do not know why the empty items appeared. The 66.7% leaves out 41 meals, and the 159 it keeps are a little easier. The other seven models gain 0.0 to 4.9 points on them. Retries also cost more: $0.0113 per scan with one request and $0.0189 with two.
In a separate preprint, Claude Sonnet 4.6 through Anthropic’s batch API returned parsed items on all of its queries (Street, Table 9). That test used another model version and another route, so it cannot explain this result.
Seven configurations on all 400 meals
Table 5 pools the first set and the holdout. It lists every configuration that ran on all 400 meals: five Gemini Flash settings, Gemini 3.5 Flash-Lite and GPT-6 Luna. Gemini 3.6, 3.7 and 3.8 Flash on low reasoning ran twice on the first set, so we average the two runs per meal. Cost and time cover all scans of a configuration.
Table 5. Every configuration on all 400 meals
| Model | Within 10 g, 95% interval | Mean absolute error, g | Bias, g | Errors above 30 g | Failed scans | Cost per scan, $ | Median time, s | Difference from Gemini 3.6 Flash, low, points |
|---|---|---|---|---|---|---|---|---|
| Gemini 3.6 Flash, medium | 73.0% 68.8 to 77.1 | 9.4 | −2.7 | 5.5% | 0 | 0.0059 | 6.6 | +4.1 +1.6 to +6.7 |
| Gemini 3.7 Flash, medium | 72.5% 68.2 to 76.5 | 9.3 | −3.0 | 6.8% | 0 | 0.0060 | 5.8 | +3.6 +0.2 to +7.1 |
| Gemini 3.7 Flash, low | 72.1% 67.9 to 76.3 | 9.3 | −2.3 | 6.0% | 0 | 0.0034 | 3.7 | +3.2 +0.3 to +6.4 |
| Gemini 3.8 Flash, low | 69.6% 65.1 to 74.1 | 9.8 | −2.2 | 7.2% | 0 | 0.0030 | 5.0 | +0.8 −2.3 to +3.9 |
| Gemini 3.6 Flash, low * | 68.9% 64.6 to 73.1 | 9.5 | −2.0 | 5.8% | 0 | 0.0031 | 3.4 | baseline |
| Gemini 3.5 Flash-Lite, low | 68.8% 64.3 to 73.2 | 10.0 | −0.9 | 7.8% | 0 | 0.0017 | 2.2 | −0.1 −3.5 to +3.4 |
| GPT-6 Luna, low | 63.2% 58.2 to 68.2 | 11.4 | +0.5 | 10.2% | 0 | 0.0003 | 7.6 | −5.6 −10.3 to −1.0 |
Three configurations score above Soba’s setting, Gemini 3.6 Flash on low reasoning, with intervals that exclude zero: +4.1, +3.6 and +3.2 points. GPT-6 Luna scores 5.6 points below it, with an interval from −10.3 to −1.0.
Two checks weaken those gains. Gemini 3.7 Flash led the first set out of eight models, so the first set overstates it. On the holdout alone, its lead over Gemini 3.6 Flash is 0.0 points.
Medium reasoning on Gemini 3.6 Flash gains mostly at the 10 g line. Within 5 g it scores 49.0% against 50.2%, and its errors above 30 g stay at 22 against 23. It also doubles the cost, $0.0059 against $0.0031, and the time, 6.6 s against 3.4 s.
The holdout: a check on other meals
We studied errors and tuned the prompt on the first set only. The holdout served as a check, and this page quotes none of its single meals. GPT-6 Luna Pro, GPT-6.1 Sol and Claude Sonnet 5.5 did not run on it.
Table 6. Seven configurations on the holdout of 200 meals
| Model | Within 10 g, 95% interval | Mean absolute error, g | Bias, g | Errors above 30 g | Failed scans | Cost per scan, $ | Median time, s | Difference from Gemini 3.6 Flash, low, points |
|---|---|---|---|---|---|---|---|---|
| Gemini 3.6 Flash, medium | 73.0% 67.2 to 78.7 | 9.1 | −3.7 | 6.0% | 0 | 0.0061 | 6.6 | +2.5 −1.0 to +5.9 |
| Gemini 3.6 Flash, low * | 70.5% 64.5 to 76.4 | 9.1 | −2.9 | 6.0% | 0 | 0.0033 | 3.7 | baseline |
| Gemini 3.7 Flash, low | 70.5% 64.3 to 76.4 | 9.1 | −3.6 | 6.5% | 0 | 0.0034 | 3.8 | 0.0 −4.6 to +4.6 |
| Gemini 3.7 Flash, medium | 68.5% 62.1 to 74.5 | 9.5 | −4.0 | 7.0% | 0 | 0.0061 | 5.8 | −2.0 −6.7 to +2.8 |
| Gemini 3.5 Flash-Lite, low | 68.5% 62.2 to 74.8 | 9.9 | −2.2 | 9.5% | 0 | 0.0017 | 2.3 | −2.0 −7.5 to +3.5 |
| Gemini 3.8 Flash, low | 67.0% 60.3 to 73.6 | 9.7 | −3.4 | 7.5% | 0 | 0.0031 | 5.1 | −3.5 −8.0 to +1.0 |
| GPT-6 Luna, low | 61.5% 54.3 to 68.6 | 12.0 | −0.1 | 12.5% | 0 | 0.0004 | 8.2 | −9.0 −15.6 to −2.6 |
- The lead of Gemini 3.7 Flash did not repeat: +5.5 points on the first set, 0.0 (−4.6 to +4.6) on the holdout.
- GPT-6 Luna stayed below Gemini 3.6 Flash: −9.0 points (−15.6 to −2.6).
- Gemini 3.5 Flash-Lite stayed level on the share, −2.0 points (−7.5 to +3.5), with more errors above 30 g: 19 against 12.
- Medium reasoning on Gemini 3.6 Flash gained 2.5 points, with an interval from −1.0 to +5.9.
The data file lists the holdout meals, so they are no longer unseen. A later test needs new meals.
Where all models fail
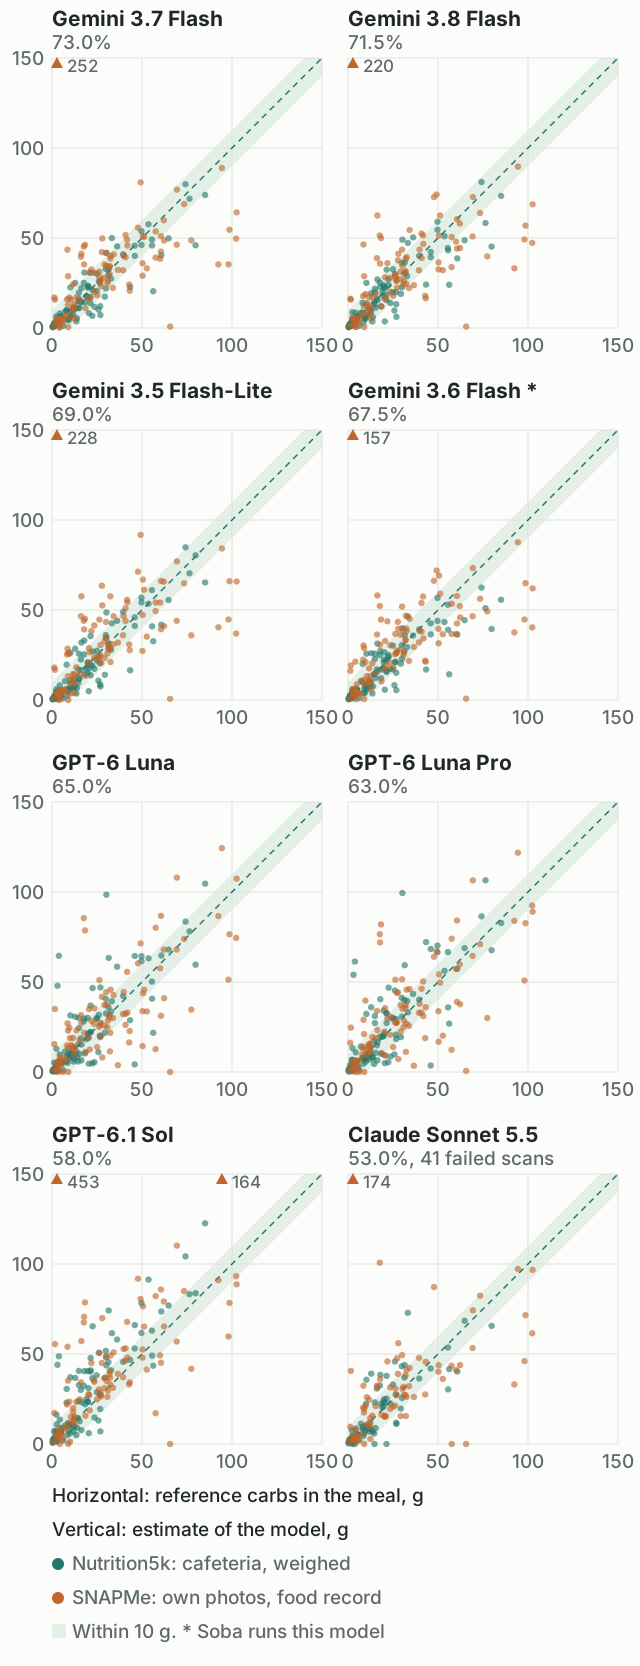
Meal size moves the share more than the choice of model. Under 15 g of carbs, the eight models reach 75% to 93%. At 60 g or more they reach 18% to 45%. Across all meals, the gap between the models is 20 points.
Table 7. Share within 10 g by reference carbs, first set
| Model | Under 15 g 81 meals | 15 to 30 g 51 meals | 30 to 60 g 46 meals | 60 g or more 22 meals | Mean error at 60 g or more, g | Too low at 60 g or more |
|---|---|---|---|---|---|---|
| Gemini 3.7 Flash | 90% | 67% | 70% | 32% | −23.6 | 20 of 22 |
| Gemini 3.8 Flash | 93% | 73% | 54% | 27% | −23.5 | 20 of 22 |
| Gemini 3.5 Flash-Lite | 86% | 65% | 59% | 36% | −21.1 | 17 of 22 |
| Gemini 3.6 Flash * | 85% | 71% | 57% | 18% | −27.4 | 21 of 22 |
| GPT-6 Luna | 86% | 59% | 43% | 45% | −6.4 | 11 of 22 |
| GPT-6 Luna Pro | 84% | 53% | 48% | 41% | −6.8 | 16 of 22 |
| GPT-6.1 Sol | 80% | 47% | 48% | 23% | +2.2 | 10 of 22 |
| Claude Sonnet 5.5 | 75% | 45% | 37% | 23% | −21.2 | 11 of 15 |
Large plates come out too low
At 60 g or more, Gemini 3.6, 3.7 and 3.8 Flash estimate 23.5 to 27.4 g too low on average. They come out too low on 20 or 21 of 22 meals. Gemini 3.5 Flash-Lite and Claude Sonnet 5.5 estimate about 21 g too low. The OpenAI means look closer to zero, −6.8 to +2.2 g, because large errors go both ways: GPT-6.1 Sol runs from −65.6 to +69.9 g. Their shares in this band stay at 23% to 45%.
The holdout agrees. On its 20 meals at 60 g or more, five models estimate 19.3 to 24.7 g too low on average. They come out too low on 14 to 18 of the 20 meals. The higher share of GPT-6 Luna in this band did not repeat: 10 of 22 meals on the first set, 5 of 20 on the holdout.
Table 8. Estimated weight divided by reference weight, median, first set
| Model | Under 100 g 53 meals | 100 to 200 g 44 meals | 200 to 400 g 73 meals | 400 to 600 g 25 meals | 600 g or more 5 meals |
|---|---|---|---|---|---|
| Gemini 3.7 Flash | 1.12 | 1.00 | 0.90 | 0.66 | 0.41 |
| Gemini 3.8 Flash | 1.17 | 1.00 | 0.89 | 0.67 | 0.47 |
| Gemini 3.5 Flash-Lite | 1.07 | 0.98 | 0.90 | 0.69 | 0.40 |
| Gemini 3.6 Flash * | 1.22 | 0.99 | 0.85 | 0.63 | 0.47 |
| GPT-6 Luna | 1.25 | 1.01 | 0.97 | 0.71 | 0.45 |
| GPT-6 Luna Pro | 1.27 | 1.02 | 1.00 | 0.74 | 0.40 |
| GPT-6.1 Sol | 1.73 | 1.23 | 1.18 | 0.92 | 0.53 |
| Claude Sonnet 5.5 | 1.22 | 1.04 | 0.93 | 0.70 | 0.39 |
Table 8 points to portion weight. A value of 1.00 means a correct weight. All eight models pull weights toward a typical portion. Plates of 400 to 600 g come out at 0.63 to 0.92, and plates of 600 g or more at 0.39 to 0.53. The holdout gives 0.73 to 0.80 and 0.43 to 0.49, on five models.
- A weighed breakfast plate of 558 g came out at 320 to 530 g. Its 79.8 g of carbs came out at 39 to 84 g.
- A curry with rice, 662 g in the diary, came out at 270 to 445 g. Its 98.0 g of carbs came out at 35 to 60 g.
- Three whole potatoes, 510 g in the diary, came out at 180 to 420 g. Their 102.4 g of carbs came out at 37 to 93 g.
Large plates are where an estimate misses most. An estimate does not replace weighing. A kitchen scale and the label give surer numbers.
Small items come out too heavy, at a low cost in carbs
Under 100 g, the median runs from 1.07 to 1.73 on the first set and from 0.92 to 1.23 on the holdout. On weighed plates alone it runs from 0.95 to 1.73 and from 0.78 to 1.06. This effect is weaker than the one on large plates, and it depends on the set. It also costs few grams of carbs. Weighed cherry tomatoes of 64 g came out at 80 to 160 g, and their 2.5 g of carbs at 4 to 6 g.
Drinks
A photo often cannot show what a glass holds. One jar of coffee has 2.7 g of carbs in the diary. Six models read it as caramel sauce or honey and answered 157 to 453 g. The two Luna models read it as broth or a brown liquid and answered 2 g. Without this meal, the mean absolute error of the Gemini models falls to 8.3 to 9.4 g, while GPT-6 Luna stays at 10.7 g.
A sweet tea in a jar with a tea bag has 65.6 g of carbs in the diary. All eight models answered 0 to 1 g, because sugar does not show in a photo.
Errors in the reference values
All eight models came within 10 g on 71 meals. None did on 19 meals, and 15 of those are SNAPMe photos. We checked large misses of the first set against the photos and found errors in the reference values. We corrected none of them, so they lower the share of every model.
- A diary entry of 25 g of cookie, with five cookies in the photo. The models estimated 35 to 100 g.
- A diary entry of 29 g of puff pastry, with what looks like a wrapped mooncake in the photo. The models estimated 50 to 90 g.
- A Nutrition5k plate labeled as 54 g of brownies, with a bowl of rice, carrots and tomatoes in the photo. The models estimated 205 to 310 g.
What this test does not show
- It tests API models with one prompt. Another prompt could change the order, and this one was tuned on Gemini.
- It describes October 2026. Providers update their models, and these numbers can age fast.
- It tests no consumer app: the ChatGPT and Gemini apps stayed out, and so did Soba as people use it. An app adds its own prompt, image steps and checks.
- It tests one route per model, so it cannot separate a model from its route.
- It has no human baseline of our own. No person estimated these meals, so this test cannot say whether a model beats a person.
- All meals come from the US. Nutrition5k plates come from one camera setup, shot from above.
- The answer language was Russian. Other languages can differ.
- It measures carbs only. Protein, fat and calories stay outside this page.
Published figures for people come from other meals and other rules, so they do not compare with these tables. Brazeau et al. (2013) studied 50 adults with type 1 diabetes and 448 meals. Their estimates differed from a dietitian’s count by 15.4 g on average, or 20.9%. In Meade and Rushton (2016), 61 patients scored 44% on a test with food models, and 59% without the foods they marked as never eaten. A correct answer fell within 3 g of a range or 5 g of a single value.
Comparison with published work
Other groups have compared AI models on food, and this test joins that work. Only the first two rows of Table 9 use the same dataset in a similar way. The other rows use other meals, reference values and metrics, so their numbers do not compare across rows.
Table 9. Published work and this test
| Work | What it tested | Result |
|---|---|---|
| Rodríguez-Jiménez et al., Nutrients 2025 | ChatGPT-5 in the web interface, 74 SNAPMe meals, photo only. The authors corrected some reference values. | Mean absolute error 12.99 g, median 8.75 g. With a note about the meal: 11.29 g and 8.05 g. |
| This test, SNAPMe half | Eight API models, 100 SNAPMe meals, photo only. Reference values unchanged. | Gemini 3.6 Flash: mean absolute error 13.7 g, median 7.8 g. Gemini 3.7 Flash: 13.6 g and 6.4 g. |
| Nakagawa and Yamamoto, Nutrients 2026 | Six models from three vendors, 1,272 SNAPMe and 887 NutriImage meals, prompt variants. | On SNAPMe the underestimate sits in the larger meals. An instruction to estimate larger moved 83% to 100% of images upward on Anthropic and Gemini models, 34% to 39% on OpenAI models. |
| Jin et al., DiningBench, ACL 2026 | 29 models, 1,650 dishes with about 5 photos each. The full benchmark is mostly Chinese dishes. Reference values come from merchant data or from Gemini-3-Pro-Preview, checked by hand. | Mean absolute percentage error on carbs: Gemini-3-Pro-Preview 27.40%, GPT-4.1 35.81%, GPT-5 36.63%, Claude-Sonnet-4.5 51.52%. |
| Street, Diabettech 2026 | Preprint, not peer reviewed. Four models through provider batch APIs, 13 photos, 495 to 561 repeats per photo, 26,904 queries. | Median spread on one photo (coefficient of variation): Claude Sonnet 4.6 2.4%, GPT-5.4 8.4%, Gemini 3.1 Pro 10.3%, Gemini 2.5 Pro 11.0%. Claude Sonnet 4.6 also had the lowest mean absolute error, 11.6 g overall. |
| Zagaroli et al., Diabetes Obes Metab 2026 | ChatGPT, Gemini, Claude and DeepSeek on 124 meals described in text, with no photos. Clinicians gave the reference values. | Median carbs: clinicians 30.32 g, ChatGPT 30.75 g, Gemini 30.40 g, DeepSeek 29.75 g, Claude 29.25 g. |
| Tecce et al., Diabetes Care 2025 | ChatGPT-4o and Gemini Advanced against the MetaDieta software. We could not read the full letter, so these numbers come from a summary by Type 1 Better. | Errors of 35% to 45% with minimal data. With moderate data, 18% for ChatGPT and 29% for Gemini. With full data, about 13%. |
The order of the models changes from work to work. Claude Sonnet 4.5 has the largest error of the four models quoted from DiningBench. Claude Sonnet 4.6 shows the least spread and the lowest error in the Street preprint. The order depends on the model version, the route, the prompt and the reference values.
Conflict of interest
I, Maksim Danilchenko, ran this test and wrote this page. I build Soba, an app with a paid subscription that estimates carbs from photos, and I have type 1 diabetes. Soba runs Gemini 3.6 Flash on low reasoning, one of the configurations tested. The prompt comes from Soba. A result that favors Gemini suits my business, so read the tables with that in mind.
Soba’s setting ranks fifth of seven on 400 meals. Soba stays on it because Gemini 3.7 Flash did not hold its lead on the holdout and medium reasoning doubles the cost. Soba’s own API key paid for the runs. The data and the script are public, so you can check every table.
How to reproduce
Put the script and the scans file in one folder and run the script. It needs Python and nothing else, takes about 5 seconds and calls no model. It prints every number of Tables 1 to 8 and the results quoted in the text. We tested it on Python 3.11 and 3.13.
python3 reproduce.py- Per-meal results (CSV, 400 rows): dish ID, dataset, reference carbs, then the estimate and the error per model.
- All scans (CSV, 4,200 rows): one row per scan, with status, requests, estimated weight, time and cost.
- reproduce.py: Python standard library only, with the seed and clusters described above.
A second version of the calculations on NumPy gives the same shares, errors and counts. Its interval bounds differ by up to 0.3 points on Tables 1, 2, 5 and 6. On Table 3 they differ by up to 1.0, because there one meal is one point.
The files leave out the photos and the prompt. You can get the photos from the two datasets by dish ID. You can recheck every analysis, and a new run of the models needs your own prompt.
The data files carry CC BY-SA 4.0, the license of SNAPMe. We selected 400 meals from the two datasets, rounded the reference values to three decimals and added the model answers.
How to cite
Danilchenko M. Eight AI models compared on carb estimates from meal photos. Soba, November 2026. https://soba-app.com/accuracy/models/
@misc{danilchenko2026models,
  author = {Danilchenko, Maksim},
  title = {Eight {AI} models compared on carb estimates from meal photos},
  year = {2026},
  month = nov,
  howpublished = {Soba},
  url = {https://soba-app.com/accuracy/models/},
  note = {Runs of 7 October 2026}
}
A sentence you can quote: “In a test of 200 meal photos, eight AI models came within 10 g of the reference carbs on 53% to 73% of meals, with failed scans counted as misses (Soba, November 2026).”
If you quote the order of the models, please add the interval. Please also say that the author builds Soba, an app that runs one of these models.
Sources
- Thames Q, Karpur A, Norris W, et al. Nutrition5k: Towards Automatic Nutritional Understanding of Generic Food. CVPR 2021, pp. 8903-8911. arXiv:2103.03375. Dataset: github.com/google-research-datasets/Nutrition5k, CC BY 4.0.
- Chin EL, Larke JA, Bouzid YY, Nguyen T, Vainberg Y, Smilowitz JT, Lemay DG. SNAPMe: A Benchmark Dataset of Food Photos with Food Records for Evaluation of Computer Vision Algorithms in the Context of Dietary Assessment. Ag Data Commons, 2022. doi:10.15482/USDA.ADC/1528346, CC BY-SA 4.0.
- Larke JA, Chin EL, Bouzid YY, et al. Surveying Nutrient Assessment with Photographs of Meals (SNAPMe): A Benchmark Dataset of Food Photos for Dietary Assessment. Nutrients. 2023;15(23):4972. PMC10708545.
- Rodríguez-Jiménez et al. Image-Based Dietary Energy and Macronutrients Estimation with ChatGPT-5: Cross-Source Evaluation Across Escalating Context Scenarios. Nutrients. 2025;17(22):3613. PMC12655113.
- Nakagawa S, Yamamoto A. A Japanese-Dietitian Prompt Systematically Shifts Portion Estimates in LLM-Based Nutrient Estimation from Food Images: A Multi-Dataset, Multi-Model Study. Nutrients. 2026;18(17):2892. PMC13567310.
- Jin S, Zhang J, Zhang X, et al. DiningBench: A Hierarchical Multi-view Benchmark for Perception and Reasoning in the Dietary Domain. ACL 2026. arXiv:2604.10425.
- Street T. Reproducibility and accuracy of large language model vision APIs for carbohydrate estimation from food photographs (short title). Diabettech, April 2026. PDF.
- Zagaroli L, Caione N, Zara S, et al. Accuracy of ChatGPT, Gemini, Claude and DeepSeek in Carbohydrate Counting. Diabetes Obes Metab. 2026;28(7):5627-5636. PMID 41969183.
- Tecce N, Vetrani C, Pelosi AL, et al. AI-Powered Carbohydrate Counting for Type 1 Diabetes: Accuracy and Real-World Performance. Diabetes Care. 2025;48(8):e97-e98. PMID 40397829.
- Brazeau AS, Mircescu H, Desjardins K, et al. Carbohydrate counting accuracy and blood glucose variability in adults with type 1 diabetes. Diabetes Res Clin Pract. 2013;99(1):19-23. PMID 23146371.
- Meade LT, Rushton WE. Accuracy of Carbohydrate Counting in Adults. Clin Diabetes. 2016;34(3):142-147. PMC5019010.