 Soba
Soba
Accuracy test · October 2026
We tested Soba’s carb estimates on 400 meal photos
The photos come from two public research datasets where the carbs in each meal were weighed or recorded. Below are the results, the method, and the meals where Soba was wrong.
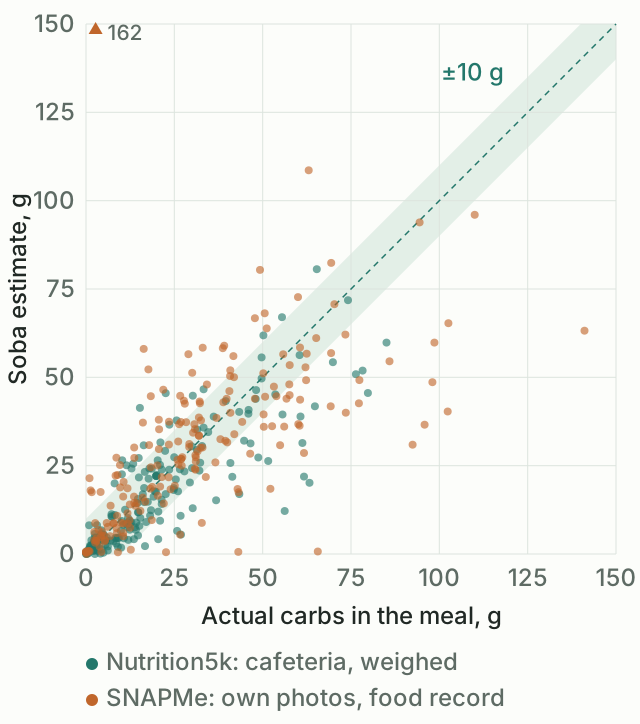
68.5%of meals within 10 g of the actual carbs, from one photo
+4points more within 10 g when a hint named the foods exactly as the study recorded them
5.2 gmedian error from one photo
What we found
The numbers in this section are Soba’s first estimates from the photo alone, before anyone corrected a weight or added a hint. 49% of the estimates were within 5 g of the actual carbs. The 95% confidence interval for the 10 g share is 64.0% to 72.9%.
Small and medium meals came out closest. For meals under 15 g of carbs, 89% of estimates were within 10 g.
Large meals were usually underestimated. In 38 of 42 meals with 60 g of carbs or more, Soba’s estimate was too low. The median estimate was 64% of the actual amount. The main cause is portion weight: in 30 of these 38 meals, Soba judged the food to weigh at least 15% less than it did, while its carbs per 100 g were usually close.
What this means when you use Soba
- For a large plate of bread, rice, pasta, potatoes or pizza, weigh the main carb food if you can. Estimates of 40 g or more were off in both directions: of 84 meals, 32 came out more than 10 g too high and 23 too low.
- Single small items, such as a cookie or a slice of pizza, sometimes come out heavier than they are.
- Sugar dissolved in a drink is invisible in a photo. In the test, a sweet iced tea was read as unsweetened. Add a short hint such as “sweet tea”, or scan the barcode.
- For packaged food, the barcode gives you the label values.
What you can add in the app
The results above come from one photo and nothing else. In the app you can add a few words about the meal, and on iPhones with a depth camera Soba also measures the distance to the food. We repeated the test with each of them.
All 400 photos
200 cafeteria photos with depth data
A text hint
A few words such as “sweet tea” or “buckwheat” add what a photo cannot show. For the test, each of the 400 photos got a hint with the names of the main foods from the dataset’s record and no amounts, for example “Coffee, brewed; Coffee creamer, liquid, fat free”. The share within 10 g rose from 68.5% to 72.8% (95% interval for the gain: 0.7 to 7.9 points), and the median error fell from 5.2 to 4.5 g.
The hint helped most where the photo could be read more than one way. Without it, Soba took that coffee with creamer for caramel sauce and estimated 162 g of carbs. With the hint it estimated 5.5 g, and the food record says 2.7 g. On the SNAPMe photos people took of their own meals, the share within 10 g rose from 59.5% to 67.5%. On the cafeteria photos, where the foods are easy to see, it barely changed: 77.5% to 78.0%.
A hint names the food, but Soba still judges the amount from the photo. Large meals were underestimated in 37 of 42 cases with a hint, and in 38 without. The test hints copied the dataset records exactly. Most of the gain came from the first set of 200 meals, 8.0 points; on the second set it was 0.5. A hint you type will likely add less.
Distance from the depth camera
When you take the photo with Soba’s camera on an iPhone with a LiDAR scanner or two or more rear cameras, Soba measures the distance to the food and tells the model how wide the frame is in centimeters. Nutrition5k includes a depth camera recording for every photo, so we repeated its 200 meals with this measurement added. The share within 10 g rose from 77.5% to 82.0% (95% interval for the gain: 1.0 to 8.3 points), and the median error fell from 3.9 to 3.1 g. Large meals were still underestimated, in 12 of 13 cases. These photos were taken straight down from a fixed height. We have not yet measured photos taken at an angle.
With both the depth measurement and a hint, the result was 78.5%. On these cafeteria photos the hint had little to add, and the 95% interval for the difference from depth alone, −8.8 to +1.5 points, includes zero.
Your corrections
If you know the portion weight, enter it, and every number recalculates. Portion weight was the main cause of large errors in this test.
Soba shows a weight range next to each estimate. On the 200 weighed Nutrition5k plates, the real weight of the plate fell inside that range in 97 cases, about half. The range shows where the model expects the weight to be. A kitchen scale is the surest check.
Results by meal size
| Actual carbs | Meals | Within 10 g | Within 20 g | Median error |
|---|---|---|---|---|
| Under 15 g | 167 | 88.6% | 98.8% | 2.0 g |
| 15 to 30 g | 94 | 69.1% | 88.3% | 6.2 g |
| 30 to 60 g | 97 | 54.6% | 84.5% | 8.4 g |
| 60 g or more | 42 | 19.0% | 38.1% | 25.4 g |
The overall result depends on this mix: 42% of the test meals had less than 15 g of carbs. If you usually eat larger meals, expect a larger typical error.
These groups use the actual carbs, which the app does not know when you scan. Grouped by Soba’s own estimate, 84 meals came out at 40 g or more, and 55 of them were off by more than 10 g: 32 too high and 23 too low. That is why the app suggests weighing the main carb food when an estimate reaches 40 g.
Four meals from the test
Two close estimates and two misses. Soba’s food names and weights are taken from its answers.
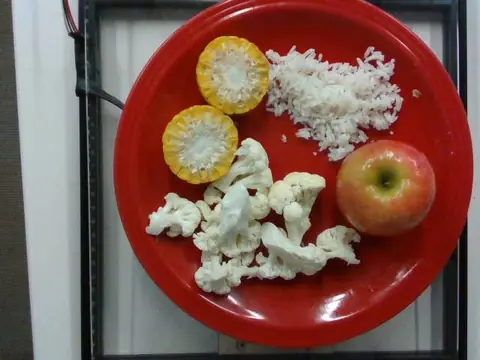
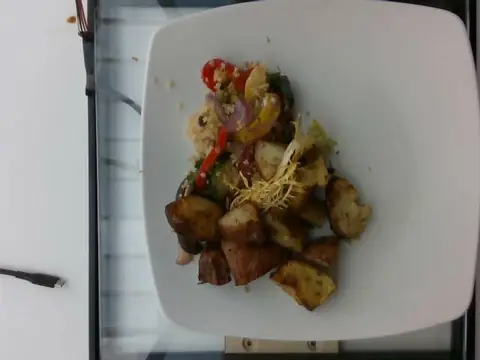
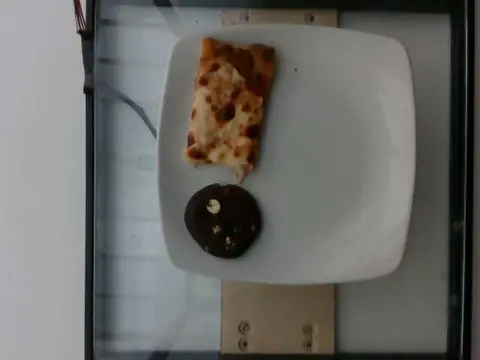
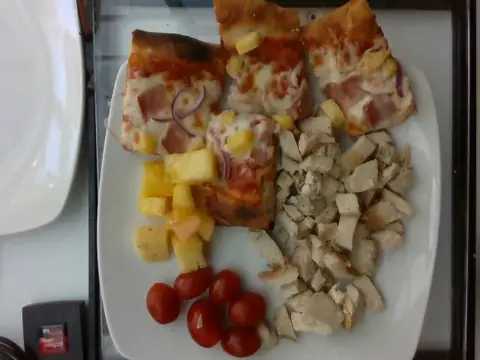
Photos: Nutrition5k dataset, Google Research, CC BY 4.0. Resized for this page.
Two datasets, two kinds of photos
| Dataset, 200 meals each | Within 10 g | Median error | Mean error |
|---|---|---|---|
| Nutrition5k | 77.5% | 3.9 g | 6.8 g |
| SNAPMe | 59.5% | 6.8 g | 12.2 g |
Nutrition5k plates come from Google cafeterias. Every ingredient was weighed, and a fixed camera took each photo straight from above. These are clean conditions, and Soba did best here.
SNAPMe is a study by the US Department of Agriculture and UC Davis. 95 people in the US photographed their own meals before eating and kept a food record in ASA24, a dietary assessment tool. The photos look like the ones people take with Soba. The reference values come from the participants’ food records, which have errors of their own. Part of the gap between the two datasets comes from the photos, and part from the reference values.
Compared with a published study
Rodríguez-Jiménez and colleagues (Nutrients, 2025) tested ChatGPT-5 on 74 SNAPMe meals using photos only. They report a mean absolute error of 12.99 g of carbs and a median of 8.75 g.
| Photo only | Meals | Mean error | Median error |
|---|---|---|---|
| ChatGPT-5 (published) | 74 | 12.99 g | 8.75 g |
| Soba | 200 | 12.2 g | 6.8 g |
The authors picked their meals differently and corrected some reference values by hand, so the two rows can be compared only roughly. They show a similar level of error. In the same study, a short note about the meal’s fat, sugar and meat lowered the mean error to 11.29 g. In Soba, a hint naming the foods lowered the mean error on its 200 SNAPMe meals from 12.2 to 10.2 g.
Which model Soba uses
We ran eight models on the first 200 meals with Soba’s instructions.
| Model | Within 10 g | Median time |
|---|---|---|
| Google Gemini 3.7 Flash | 73.0% | 3.7 s |
| Google Gemini 3.8 Flash | 71.5% | 4.8 s |
| Google Gemini 3.5 Flash-Lite | 69.0% | 2.1 s |
| Google Gemini 3.6 Flash | 67.5% | 3.3 s |
| OpenAI GPT-6 Luna | 65.0% | 6.9 s |
| OpenAI GPT-6 Luna Pro | 63.0% | 11.7 s |
| OpenAI GPT-6.1 Sol | 58.0% | 13.1 s |
| Anthropic Claude Sonnet 5.5 | 53.0% | 6.0 s |
One run per model through OpenRouter, with the request settings Soba used before October 2026. Claude Sonnet 5.5 returned an empty food item for 41 of the 200 photos through the provider OpenRouter selected. On the other photos it reached 66.7%. GPT-6.1 Sol overestimated carbs by 10 g on average.
Gemini 3.7 Flash led on these 200 meals. A model that wins one comparison out of eight often looks better than it is, so we checked it on the second set of 200 meals. There it scored the same as Gemini 3.6 Flash, 70.5% each, at a higher price. Soba stays on Gemini 3.6 Flash.
We also tried giving Gemini 3.6 Flash more time to reason. Over 400 meals the share within 10 g rose by 4.1 points, while the share within 5 g and the number of errors above 30 g stayed the same. Each scan took twice as long, 6.6 seconds instead of 3.5. We kept the faster setting.
How we ran the test
Choosing the meals
The starting pool was 505 Nutrition5k plates from the dataset’s official test split for overhead photos and 1,457 SNAPMe photos taken before eating. Before that, we removed 22 entries: plates and meals with invalid values, and SNAPMe photos that could not be matched to exactly one food record.
A script with a fixed random seed took 100 meals from each dataset: 25 from each quarter of the carb range. Cafeteria plates photographed within the same ten minutes often look alike, so the script limited how many plates it took from one ten-minute window. Then it picked a second set of 200 meals the same way, with no photos or meals shared with the first set.
Two sets
We studied errors and tried changes to Soba’s instructions only on the first 200 meals. The second 200 were used to check whether a result held up. This is how we caught the Gemini 3.7 Flash result above.
Running Soba
Each photo went through the same server code the app uses: the same instructions, model and settings. Photos were reduced to 1,024 pixels on the longest side, as the app does before sending. The main run had no text hint, no depth camera data and no correction afterwards. The runs with a hint or depth data used the same code and changed only that input. The app language was set to Russian.
Measuring the error
Soba reports net carbs (without fiber) and fiber separately. The datasets give total carbs, so we compared Soba’s net carbs plus fiber with the total. The main measure is the share of meals where the difference is 10 g or less. A failed scan would count as a miss; there were none. The 95% interval comes from a bootstrap with 10,000 resamples that keeps meals of one SNAPMe participant or one ten-minute cafeteria window together.
Limits of this test
- All meals come from the US. Nutrition5k plates were photographed from directly above with one camera setup.
- The reference values contain errors. SNAPMe values come from self-reported food records. Some Nutrition5k plates have labels that miss visible food.
- We tested recognition from photos. Text descriptions, barcode lookup and manual entry were outside the test.
- The test hints named the foods exactly as the datasets recorded them, and their gain differed widely between the two sets of meals (see “A text hint”).
- The depth result covers the 200 Nutrition5k photos only, all taken straight down.
- We measured carbs. Protein, fat and calories are outside the scope of this page.
- Model providers update their models. The results describe Soba in October 2026.
Soba is not a medical device. Its numbers are estimates. Check them against the food on your plate and product labels, and follow your diabetes care plan.
Changes after the test
- Soba’s backup model from OpenAI could not run. One request setting, temperature, is not accepted by OpenAI models, and the request allowed only providers that accept every setting. We removed the setting. The main model scored 68.9% with it and 68.5% without it, which is within the normal variation of repeated runs. Gemini 3.7 Flash and GPT-6 Luna are now the backups.
- In 9 of 3,614 test requests (0.25%), Gemini repeated one phrase over and over, and the scan took 35 to 87 seconds. Soba now limits the length of the answer, which stops such a loop earlier.
Data and sources
Per-meal results (CSV, 400 rows): dataset ID, reference carbs, Soba’s estimate from the photo alone, the hint text, and the estimates with the hint and with depth data. The file follows the SNAPMe license, CC BY-SA 4.0.
- Thames Q, Karpur A, Norris W, et al. Nutrition5k: Towards Automatic Nutritional Understanding of Generic Food. CVPR 2021. arXiv:2103.03375. Dataset: github.com/google-research-datasets/Nutrition5k, CC BY 4.0.
- Larke JA, Chin EL, Bouzid YY, et al. Surveying Nutrient Assessment with Photographs of Meals (SNAPMe): A Benchmark Dataset of Food Photos for Dietary Assessment. Nutrients. 2023;15(23):4972. PMC10708545. Data: USDA Ag Data Commons, CC BY-SA 4.0.
- Rodríguez-Jiménez et al. Image-Based Dietary Energy and Macronutrients Estimation with ChatGPT-5: Cross-Source Evaluation Across Escalating Context Scenarios. Nutrients. 2025;17(22):3613. PMC12655113.